在 series bar通过barGap调整: barGap: '0%',
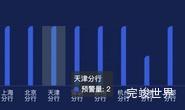
调整后前

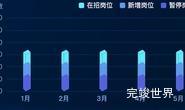
调整后
    drawLine () {
      window.addEventListener('resize', this.drawLine)
      let myChart = this.$echarts.init(this.$refs.echarts)
      var option = {
        tooltip: {
          trigger: 'axis',
          axisPointer: {
            type: 'shadow',
            label: {
              backgroundColor: 'rgba(17, 27, 54, 1)'
            }
          },
          textStyle: {
            color: '#fff',
            fontStyle: 'normal',
            fontFamily: '微软雅黑',
            fontSize: 12,
          }
        },
        grid: {
          left: '20',
          right: '5%',
          bottom: '10%',
          top: '30',
          containLabel: true,
        },
        xAxis: [
          {
            type: 'category',
            data: ['油藏1', '油藏2', '油藏3', '油藏4', '油藏5', '油藏6', '油藏7', '油藏8', '油藏9', '油藏10', '油藏11', '油藏12'],
            axisLabel: {
              textStyle: {
                color: '#078ceb',
                fontStyle: 'normal',
                fontFamily: '微软雅黑',
                fontSize: 12,
              },
            },
            axisTick: {
              show: false,
            },
            axisLine: {
              lineStyle: {
                color: '#fff',
                opacity: 0.2
              }
            },
            splitLine: {
              show: false,
            }
          }
        ],
        yAxis: [
          {
            type: 'value',
            splitNumber: 2,
            axisLabel: {
              textStyle: {
                color: 'rgba(168, 230, 243, 1)',
                fontStyle: 'normal',
                fontFamily: '微软雅黑',
                fontSize: 12,
              }
            },
            axisLine: {
              show: false
            },
            axisTick: {
              show: false
            },
            splitLine: {
              show: true,
              lineStyle: {
                color: ['#fff'],
                opacity: 0.06
              }
            }

          },
          {
            name: '配注',
            type: 'value',
            splitNumber: 2,
            nameTextStyle: {
              color: 'rgba(168, 230, 243, 1)',
              fontStyle: 'normal',
              fontFamily: '微软雅黑',
              fontSize: 12,
              padding: [0, 0, 0, 30]
            },
            axisLabel: {
              textStyle: {
                color: 'rgba(168, 230, 243, 1)',
                fontStyle: 'normal',
                fontFamily: '微软雅黑',
                fontSize: 12,
              }
            },
            axisLine: {
              show: false
            },
            axisTick: {
              show: false
            },
            splitLine: {
              show: true,
              lineStyle: {
                color: ['#fff'],
                opacity: 0.06
              }
            }

          },
        ],
        series: [
          {
            name: '油藏',
            type: 'bar',
            stack: '1',
            data: [80, 80, 80, 80, 80, 80, 80, 80, 80, 80, 80, 80, 80, 80],
            barWidth: '20%',
            barGap: '10%',
            label: {
              show: true,
              position: 'top',
              textStyle: {
                color: 'rgba(1, 221, 237, 1)',
                fontFamily: 'DIN',
                fontWeight: 'bold'
              }
            },
            itemStyle: {
              normal: {
                show: true,
                color: new this.$echarts.graphic.LinearGradient(0, 0, 0, 1, [{
                  offset: 0,
                  color: 'rgba(3, 167, 240, 1)'
                }, {
                  offset: 1,
                  color: 'rgba(17, 44, 111, 1)'
                }]),
              }
            },
          },
          {
            name: '油藏2',
            type: 'bar',
            stack: '1',
            yAxisIndex: 1,
            barWidth: '20%',
            barGap: '-110%',
            z: 0,
            label: {
              show: true,
              position: 'top',
              textStyle: {
                color: 'rgba(1, 221, 237, 1)',
                fontFamily: 'DIN',
                fontWeight: 'bold'
              }
            },
            itemStyle: {
              normal: {
                color: new this.$echarts.graphic.LinearGradient(0, 0, 0, 1, [{
                  offset: 0,
                  color: 'rgba(3, 167, 240, 0.2)'
                },
                  {
                    offset: 1,
                    color: 'rgba(17, 44, 111, 0.2)'
                  }
                ]),
              },
            },
            data: [160, 160, 160, 160, 160, 160, 160, 160, 160, 160, 160, 160, 160, 160]
          },
          {
            name: '油藏3',
            type: 'bar',
            stack: '2',
            data: [76, 76, 76, 76, 76, 76, 76, 76, 76, 76, 76, 76, 76, 76, 76, 76],
            barWidth: '20%',
            barGap: '10%',
            label: {
              show: true,
              position: 'top',
              textStyle: {
                color: 'rgba(237, 152, 2, 1)',
                fontFamily: 'DIN',
                fontWeight: 'bold'
              }
            },
            itemStyle: {
              normal: {
                color: new this.$echarts.graphic.LinearGradient(0, 0, 0, 1, [{
                  offset: 0,
                  color: 'rgba(238, 152, 2, 1)'
                },
                  {
                    offset: 1,
                    color: 'rgba(23, 25, 30, 1)'
                  }
                ]),
              },
            },
          },
          {
            name: '油藏4',
            type: 'bar',
            yAxisIndex: 1,
            barWidth: '20%',
            barGap: '10%',
            z: 0,
            stack: '2',
            label: {
              show: true,
              position: 'top',
              textStyle: {
                color: 'rgba(237, 152, 2, 1)',
                fontFamily: 'DIN',
                fontWeight: 'bold'
              }
            },
            itemStyle: {
              normal: {
                color: new this.$echarts.graphic.LinearGradient(0, 0, 0, 1, [{
                  offset: 0,
                  color: 'rgba(238, 152, 2, 0.2)'
                },
                  {
                    offset: 1,
                    color: 'rgba(23, 25, 30, 0.2)'
                  }
                ]),
              },
            },
            data: [140, 140, 140, 140, 140, 140, 140, 140, 140, 140, 140, 140, 140]
          },
        ]
      }
      myChart.clear()
      myChart.resize()
      myChart.setOption(option)
    }